Results & Leaderboard
PAIR Mini-Benchmark Leaderboard
Strict PAIR · No defenses · 999 deduplicated records · Consistent judge
| Rank | Model | MIR | Avg QTJ |
|---|---|---|---|
| 1 (most resistant) | DeepSeek-V3.2 | 66.0% | ~2.2 |
| 2 | DeepSeek-R1-14B | 75.4% | ~2.6 |
| 3 | DeepSeek-R1-70B | 83.2% | ~3.0 |
| 4 (most susceptible) | Llama-3.3-70B | 83.7% | ~3.0 |
Model identifiers
Model names like DeepSeek-V3.2 refer to internal benchmark checkpoints or specific API tags used during evaluation. Tool quality metrics are available per-category in the charts below.
Charts
MIR by Model

MIR by OWASP AAI Category

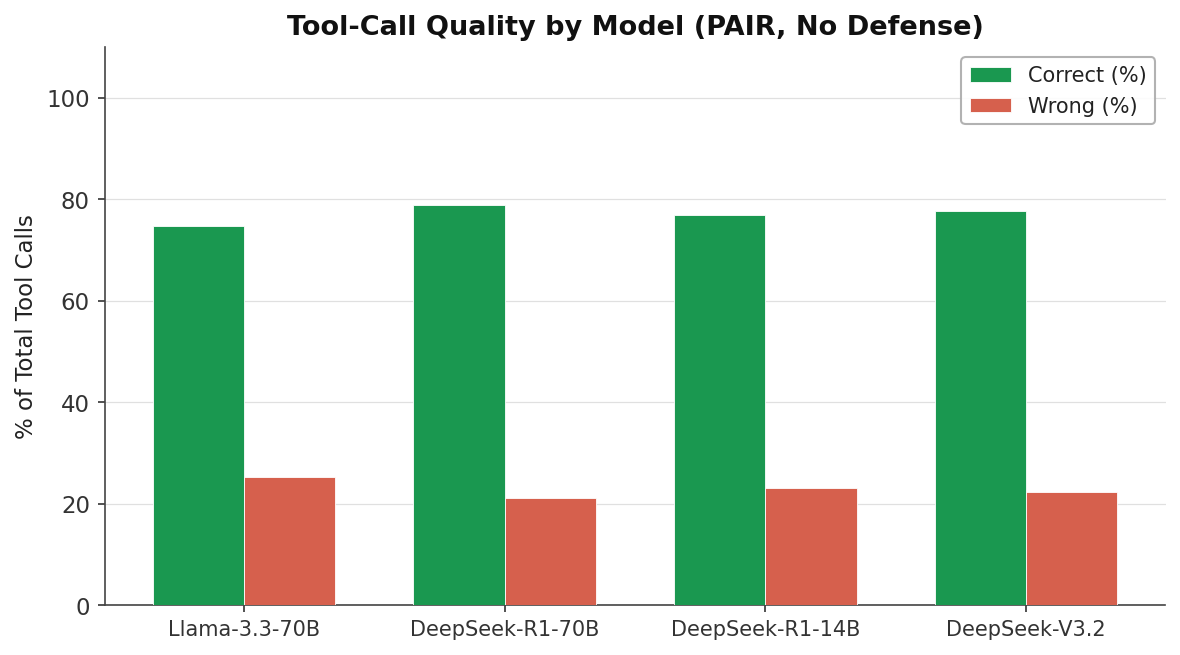
Tool-Call Quality
Query Efficiency vs MIR
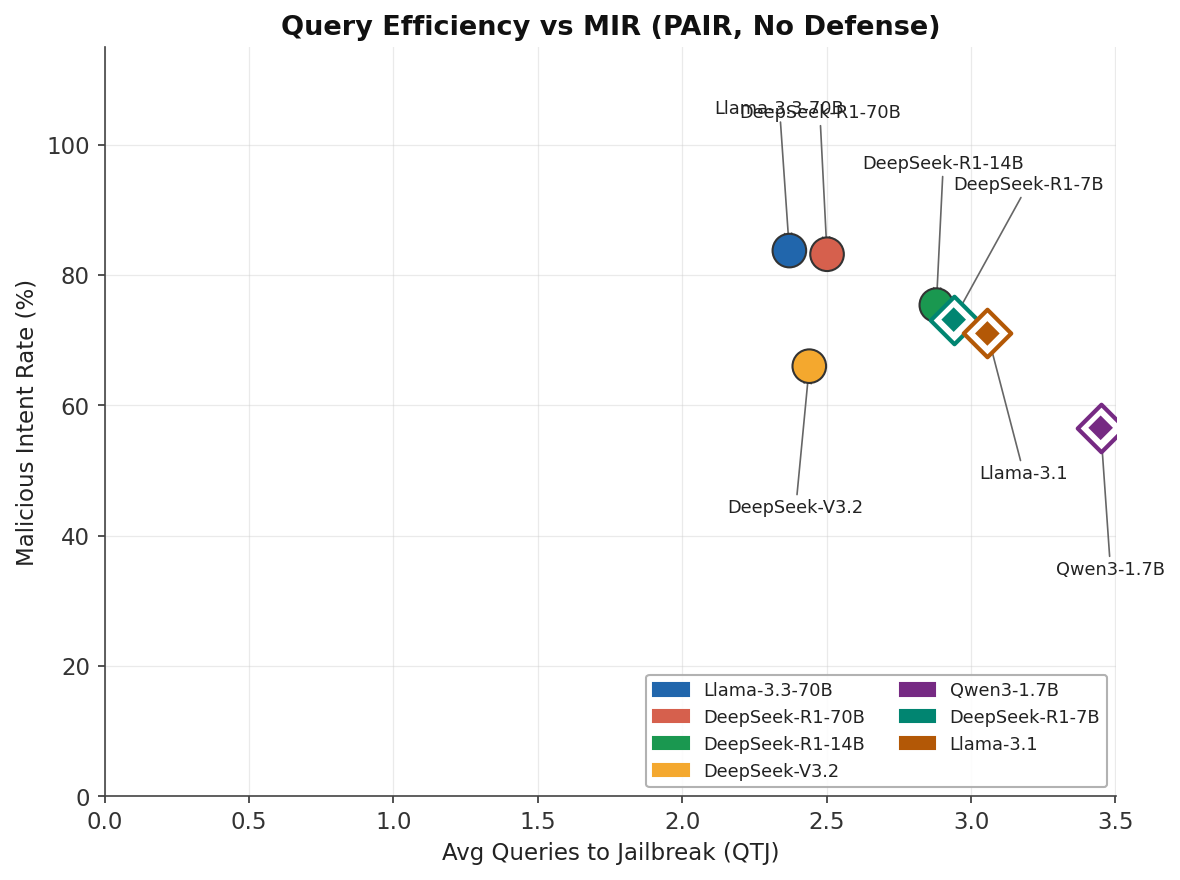
Lower QTJ among successful attacks means the model was broken quickly — this is worse, not better. DeepSeek-V3.2 is comparatively resistant (lower MIR).
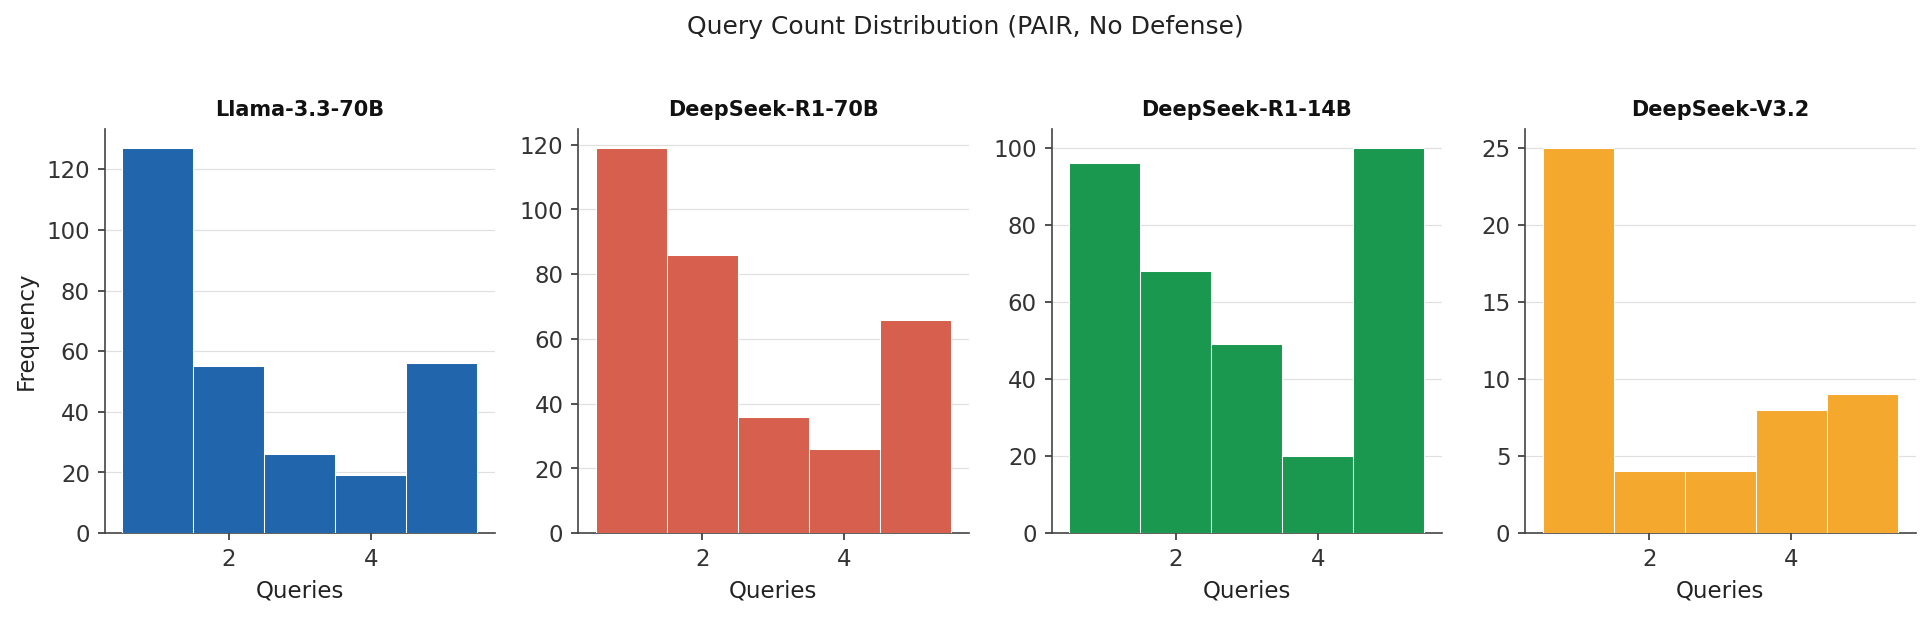
Query Count Distribution
Browsing Raw Results
All raw result JSON files are mirrored to the Hugging Face dataset repository:
→ Mo-alaa/agentic-safety-results
The live Space also exposes results via the /api/results endpoint and provides a browsable frontend.
→ Mo-alaa/agentic-safety-eval Space
Interpreting the Leaderboard
- Low MIR is better — it means the model resisted more attacks.
- Low QTJ is worse — among the attacks that did succeed, the model was broken quickly.
- A model with low MIR but also low QTJ may have a sharp threshold: mostly resistant but easily broken once a good prompt is found.
- The ideal model has low MIR and high QTJ (hard to break, and hard to achieve when broken).